Tony Ryall on Aged Care

The NZ Herald has a story today on a study that found that 23% of a sample of rest home residents in Wanganui (NZ provincial city of about 45,000) are malnourished. It’s really a shocking statistic, but the story is even more appalling for comments attributed to Health Minister Tony Ryall. The article says –

Minister of Health Tony Ryall had not read the report but understood malnourishment rates were comparable with Australia and other parts of the world.

What? I don’t know if this is a case of an incomplete quotation giving a misleading impression of what the Minister has said, but on the face of it I have to say that I find these comments pretty disgraceful. The idea that a comparison of malnourishment of the elderly in NZ with the rest of the world has any relevance at all to how we should feel about elderly people in NZ being malnourished suggests an astonishing failure to grasp the seriousness of the issue. There is no world in which it is acceptable for 23% of the residents of 15 rest homes to be malnourished. One can only hope that Tony Ryall is the victim here of some very poor reporting (which actually would not be that surprising – this is the NZ Herald after all).

Speaking of poor reporting, writer Celeste Anstiss didn’t think it important to mention who actually conducted the study she reported or where it can be obtained from. She also notes that “aged care experts want a nationwide review of rest home meals”, but gives absolutely no indication of who these ‘experts’ are. I despair.

Posted in New Zealand | Leave a comment

NZ Business and Employment Statistics

Last week the NZ Statistics Department released the “NZ Business Demography Statistics: At February 2010.” The data was reported by Newstalk ZB, who also had their story published by the NZ Herald.

The business demography statistics are primarily concerned with the rate at which businesses are being started and closed. The summary statement provided with the release notes that there were 43,700 ‘enterprise births’ over the year to February, down 20.4 percent from the previous year, while there 55,040 ‘enterprise deaths’ over the same time, up 6.0 percent from the previous year. They also note that at February 2010 there were 470,350 enterprises, down 1.7 percent compared with February 2009.

However, when I looked closely, the numbers didn’t seem to quite add up. If you calculate the nett company start-ups/closures for the year, it looks like they amount to more than the 1.7% fall in total businesses that was reported. I contacted Newstalk ZB to to ask for clarification (before I had seen the Statistics Department website) and got an automated response saying they would get back to me within 24 hours. And that was the last I heard from them – thanks a lot!

However I did have more success with the Statistics Department – someone’s taxes at work :). They explained to me that the business birth and death statistics are not quite what they seem. Rather than representing businesses started and closed in one year, the numbers are actually each counted over two consecutive years, which is why they aren’t consistent with the year-on-year percentage change in the overall number of businesses.

Ok, I don’t expect anyone other than me to find that interesting! But is there anything else here worth knowing about? In the original report, what stood out to me was the fact that start-ups were down 20% and business closures up by 6%. On the face of it, that sounds a bit dire and I guess it is, although as a fraction of total businesses the corresponding drop of 1.7% seems a little less calamitous.

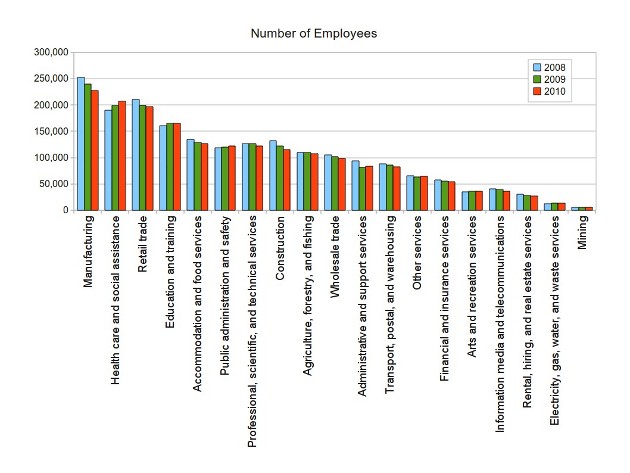
However I did find a couple of other things that I think are interesting – though again I’m probably the only person who thinks so :). Table 1 in this spreadsheet provides a breakdown of both businesses and employees by industry sector, using the ‘ANZSIC 2006‘ classification scheme. The business numbers aren’t particularly interesting, but the employment data a little more so. I went back and found the corresponding data for both 2008 and 2009, and compared total employment in each major classification category between all three years. This is what I found –

Note that I have ordered the classifications by the number of employees in each one in 2010. A couple of things I think are worth highlighting –

  • I was surprised (pleasantly) to see that manufacturing employs the largest number of people in NZ (I’m not sure what I would have guessed if you’d asked me before I’d seen the data, but I don’t think of NZ as a strong manufacturing country). I was also surprised by the fact that healthcare and social assistance employs the second largest number.
  • Based on these statistics there has been an overall drop in employment of 4% over the past three years. The three biggest decreases have been in manufacturing, retail and construction, collectively accounting for 2.8%. Over the same period, the three largest increases in employment have been in healthcare and social assistance, education and training and public administration and safety, which together amount to an increase of 1.2% of total employment. So as well as an overall drop in employment, there seems to be a small shift away from the part of the economy that creates and sells things into the part that essentially provides the social infrastructure that supports those activities.
Posted in Economics, New Zealand | Leave a comment

Responsibility

A few days ago, I watched an interview that Tavis Smiley did recently with Time magazine columnist Joe Klein on PBS (video here) and I was struck by this statement Klein made while talking about people he met on a recent tour around the country –

One guy, a deputy police chief, started talking about his neighbors, who had been his best friends, who had just walked away from their mortgage, and he thought that that was immoral because it lowered the property values of all the properties around them. He said, “Would our parents have ever walked away from a contractual obligation like that? I don’t think so. What’s happening to us as a people?”

… I think that people look at our parents, people my age, baby boomers, and also younger people, look at our parents and saw people who had a very strict code of ethics, who had gone through the Depression, World War II, who had worked hard, who kept themselves informed as citizens in a way that we don’t, and they wonder whether we’re measuring up on the leadership level, but also in our own lives.

Both points that Klein makes are interesting – that people today are less inclined than in past generations to view their financial obligations as a moral responsibility and less inclined to take seriously their civic responsibility to be well informed about world they live in. The comments are interesting partly, I think, because so much public discourse today revolves around the views of politicians and their supporters, who are happy to demonize their opponents but have a very strong vested interest in not expressing criticism of the public at large. So Klein’s remarks strike me as being refreshingly outside that norm.

It’s hard for me to comment on how people’s attitude’s  today compare with past generations (really, I’m not old enough to have any insights about that at all :)). Nonetheless, Klein’s comments are consistent with my own impression of the situation in the US today.

In the wake of the global financial crisis, few people seem willing to suggest that people who lose their homes through foreclosure are actually responsible for the situation they find themselves in. Given the key role that the behavior of many mortgage originators and financial institutions played in creating the conditions that led to the crisis, it’s understandable that people tend to focus their criticism there. However none of this, in my view, absolves individual borrowers of responsibility for financial commitments they find they are unable to meet.

The reluctance to criticize borrowers was evident in Paul Krugman’s column in the New York Times this week. Referring to precisely such criticism he went as far as to claim that “that kind of moralizing is the reason we’re mired in a seemingly endless slump” and “governments should be promoting widespread debt relief“. Sometime soon I hope to say more about Professor Krugman and his particular brand of liberal advocacy, but for now I just point out that his attitude seems to reflect a pretty common inclination to simply discount any responsibility that borrowers have for not meeting their commitments.

On the other point that Klein makes, that people don’t take as much responsibility as they should for staying informed about the world, I think there is truth here as well. The just-completed US election campaign is probably indicative of this – it’s disappointing that there seems to have been so little attention given to really serious debate on substantive issues and yet so much energy has been expended attacking the character of the candidates.

Having said that, I also think that the world is more complicated than it once was and frankly it takes a lot of effort to truly understand some of what is going on around us. It’s unfortunate in view of that that the media do not do a better job of helping people to see beyond the theater of politics to digest some of that complexity. Still, at the end of the day, the responsibility for being well informed about the world belongs to each of us and sadly I think there is a lot more ignorance around than is good for us.

Posted in Ethics, Society | Leave a comment

Latest NZ Trade Data

[Last updated 10/31: After re-reading the original version of this post and checking the data from the Statistics Department again, I realized I had misinterpreted a couple of numbers in the Herald article – which I guess illustrates why I wrote it in the first place… the Herald’s article is really not easy to understand. I have updated the post to reflect my current (hopefully correct) understanding.]

Well I wasn’t really planning on writing about trade (lots of other things buzzing around my mind), but the NZ Herald had a report yesterday on some data just released by the NZ Department of Statistics, and as they often do, numbers caught my attention. Here’s what the Herald had to say –

New Zealand’s annual traded surplus widened last month as the nation shipped more dairy products, logs and crude oil while a tepid domestic economy constrained imports.

The trade surplus was $921 million in the 12 months ended September 30, from a revised surplus of $892 million in the year through August, according to Statistics New Zealand.

The monthly traded deficit was $532 million, up from a gap of $413 million in August.

Exports in September rose 12 per cent to $3.16 billion, for an annual increase of 0.5 per cent to $41.8 billion. Monthly imports rose 9.1 per cent to $3.69 billion for an annual decline of 5.5 per cent to $40.88 billion.

… all of which kind of left me scratching my head. The fact that “the annual trade surplus widened last month” sounds like a good thing. The fact that “the monthly traded deficit was… up” sounds like maybe not such a good thing. And what are we supposed to make of the numbers themselves? Are they big? Small? The Herald really didn’t make much of an effort to help me figure out what the ‘take home’ messages should be. Yet I needed to know…

The idea of a trade surplus (or deficit) is straightforward enough – the difference between the total value of the country’s exports and imports over some period of time. Things can get a little more complex, though, because there are different ways of describing how these three measurements (exports, imports and their difference) change over time. In fact three different ways of comparing such measurements are used in the Herald’s article. Here’s what’s going on…

The Statistics Department calculates the value of exports and imports and the surplus or deficit they represent on a monthly basis. So we can use these numbers directly to compare values for the current month with those in the previous month. Given a specific set of numbers, we might conclude, for example, that imports are greater this month than last or that the surplus is smaller than last month etc.

Looking at the data on a month by month basis is interesting, but it has the disadvantage that the figures are likely to be influenced by seasonal factors. Consequently, it may be difficult to draw conclusions about overall longer term trends just by looking at the data in this way. An alternative is to add the values for each of the previous 12 months together and get a figure for the whole of the past year. Again, we can do this for either export or import values or for the surplus or deficit they produce. Once we do this, there are then two different ways that we might choose to describe how the resulting measurements are changing over time (actually there are many possibilities, but two are used in the data reported by the Herald).

One option is to take any one of these values, let’s say the surplus, calculated for the year that ended with the current month, and compare it with the corresponding value for the year that ended one month earlier. Note that together the two values we’d be comparing make use of data recorded over a total period of one year and one month, essentially by taking a moving sum of the monthly data. So the two totals each involve data for mostly the same months. If we were comparing the surplus for the year to September with the surplus for the year to August, for example, both values would contain data from October last year to August this year. The difference is that the total for the year to September also includes the data from this September, while the total to August instead includes data from last September.

What this means is that any difference between the totals for the year to September and the year to August are due entirely to differences between the data for the month of September this year and the month of September last year. Comparing the two total values is actually equivalent to comparing data between just those two months, September this year and September last year. So if, for example, the total (exports, imports, surplus or deficit) for the year to this September is X dollars greater than the total for the year to August, it means that the data for just the month of September this year is X dollars greater than that for the month of September last year.

Ok, I said before that there are two ways we can describe how the total data for one year changes over time. The second option is to take the total (again, exports, imports, surplus or deficit) for the year that just ended and compare it to the total for the year that preceded that one, or, in other words, the year that ended one year ago.

Obviously, this involves taking account of data recorded over a total period of two whole years rather than a year and one month. Why would we do this? Well, again, it helps to smooth out short term variations and gives us a better idea of longer term trends in the data. A sharp spike in (say) the deficit in one month may cause the deficit calculated for the year up to that month to rise compared with the month before. But if the overall trend over the past several months has been a decreasing deficit, it may be premature to conclude that the trend we’d been observing has been reversed, just based on that one month. The upward spike may be simply a short term anomaly and it may turn out that subsequent data will  show that the overall trend continues to be one in which values are decreasing over time. Comparing totals over a year for two consecutive years is a more reliable way to identify what that long term trend is.

Ok, let me summarize –

  • there are three different types of data involved in the Herald’s report – export values, import values and the difference between them, which can be either a surplus or deficit.
  • any of this information can be calculated for either a single month or an entire year (and of course there are any number of other possibilities as well, but these are the ones the Herald article is concerned with).
  • any value that has been calculated for a whole year (exports, imports, or surplus/deficit) can be compared in time with either the year that ended a month ago or the one that ended a whole year ago.

And so to the data… What is it that the Herald is reporting? The following –

  • For just the month of September 2010, total exports were valued at $3.16 billion and imports at $3.69 billion, resulting in a deficit for that month of $532 million.
  • The deficit in August was lower than September at only $413 million. The Herald didn’t report the export and import values for August, but the Statistics Department’s data shows that exports were very slightly lower than September at $3.15 billion, while imports were significantly less than September at $3.56 billion.
  • The total value of exports over the whole year to September was $41.8 billion, while imports for the same period were $40.88 billion. This resulted in a trade surplus for the year of $921 million. Note that we had a surplus for the year to September even though there was a deficit of $532 million for the month of September by itself, because there were some good months during the rest of the year. Was September itself a good month or bad? To the extent that there was a deficit for that month, you might say it was bad. However if we recognize that there is always some seasonal variation over the course of a year, we can’t really conclude that without looking at the year as a whole. And what we find is that the year as a whole was ok. But really, we want to know more than that – based on the figures for September, are things getting better or worse?
  • The answer is that the trade balance seems to be getting better. While we had a trade surplus of $921 million in the year to September, in the year to August the trade surplus was lower, at $892 million – not by much, but lower nonetheless. Note that the surplus for the year to September got better even though the deficit in September actually deteriorated from the previous month (remember, it went from $413 million to $532 million). What this implies is that the September data, though poor (in the sense of being in deficit), was better than it was a year ago in September 2009. We can confirm this from the Statistics Department’s data: Table 1 in this Excel spreadsheet available here shows that while the deficit for September 2010 was $532 million (column J, row 60) as reported by the Herald, the deficit in September 2009 was even worse at $561 million (column J, row 47).
  • As well as wondering whether the surplus has improved, we’re also interested in knowing why it has improved. Does it reflect an improvement in exports or a reduction in imports, or both? The Herald doesn’t really provide as much clarity on this point as we might hope. They do note that exports in September rose 12% to $3.16 billion while imports rose 9.1% to $3.69 billion. However, they don’t make it clear that these numbers represent the change from September last year, rather that from August this year. This is what we need to know to understand that these numbers do actually relate to the reported improvement in the surplus. Remember that that improvement related to the total surplus for the year to September ($921 million) compared with the total for the year to August ($892 million). And the difference between those two values is the same as the difference between the values for the month of September this year and September last year. The 12% increase in exports amounts to $335 million while the 9% increase in imports represents $306 million. So it is the fact that exports have increased from one year ago more rapidly than imports that accounts for the fact that the surplus has increased by 335-306 = $29 million from $892 million to $921 million. This presumably is what the  Herald is referring to when it says that “New Zealand’s annual traded surplus widened last month as the nation shipped more dairy products, logs and crude oil while a tepid domestic economy constrained imports.” However that statement on its own is arguably a little misleading or at least confusing given that the trade balance for the month it’s referring to was actually in deficit and worse than the month before it.
  • The Herald also cites two other numbers – an ‘annual increase’ in exports of 0.5% and an ‘annual decline’ in imports of 5.5%. They don’t make it especially clear, but these numbers represent the difference between the totals for the year to September and the totals for the year that ended one year earlier. It’s interesting that these numbers show a somewhat different trend compared with the change in the monthly values between September 2009 and September 2010, with exports increasing only very slightly and imports decreasing rather than increasing.

It’s a bit unfortunate that the Herald’s report doesn’t say more about the trends in exports and imports, since more information is actually available. The numbers that the Herald reports describe the differences in exports and imports between September this year and September last year – in one case the values in those specific months (increasing 12% and 9% respectively) and in the other the total over the year ending at each of those months (increasing 0.5% and decreasing 5.5% respectively).

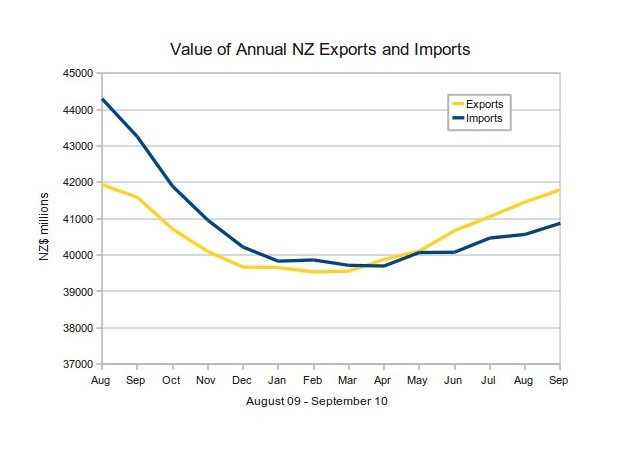
However the data released by the Statistics Department also tell us something more about what has happened over the course of the year in between those months. To illustrate, the chart below plots exports and imports calculated over multiple periods of one year ending at each month between August last year and September this year. The numbers are derived from column G in Table 1 of the same spreadsheet I mentioned before. The spreadsheet only provides values for individual months, so I calculated the sum over each 12 month period myself.

The chart shows that from a significant trade deficit in August 2009 (which is not mentioned in the Herald article), there has been a consistent improvement in the trade position over the past year. Initially, exports and imports both fell away towards the end of last year, but imports more than exports. Subsequently, exports and imports have both started to increase, and exports more than imports, leading to a growing surplus. Note that the vertical scale doesn’t start at zero, so the magnitudes of deficits and surpluses look a little exaggerated. In August last year, the deficit was 5.6% of export receipts, while in September this year the surplus was 2.2%.
There is also another way we can get some perspective on the size of the trade surplus and that’s to compare it with gross domestic product. The latest available figure is for the year to June this year – NZ$ 133 billion (source: Table 2.1 of this spreadsheet, available here; add the last four quarterly figures shown in column P).  This puts the total export and import figures in some perspective: the roughly $41 billion for each is around 31% of GDP, and the trade surplus of $921 million for the year to September represents about 0.7% of GDP. In other words, it’s pretty small.

Part of the reason that I take interest in the trade figures is because they form part of the current account. So another question I have is how does the size of the trade surplus relate to the size of the current account? Well, this post is already way longer than I expected it to be. So that question will have to wait for another time.

Posted in Economics, New Zealand | Leave a comment

Lucid Lynx

Yes, I’ve been a little quiet again. My server got hacked and the good folks at slicehost where it lives asked me to rebuild the machine from scratch.

It’s taken some effort, not so much for the blog, but more so for my merb work. Anyhow, I now have my sites running on a new virtual machine running Ubuntu Linux 10.04 LTS, aka “Lucid Lynx”. It’s not the absolute latest version of the operating system, but it’s the latest ‘LTS’ (Long Term Support) version.

Just thought you should know.

Posted in Website | Leave a comment

Why Banks Aren’t Lending

Well it’s been a couple of weeks since my last blog entry, mainly because I’ve been spending time with some of my family who were visiting from NZ. It was great to have them here, but now that they’re gone I’m eager to get back to some writing.

A lot of my interest at the moment is in tax policy and I have some thoughts I’m hoping to share shortly, though I’ve been spending quite a lot of time digging out some solid data to ensure that I can accurately characterize the issues I’m concerned about. More on that in due course.

At the same time, I am also keeping my eye on some other economic issues, notably, at the moment, the expectation that the Federal Reserve is going to launch a second round of quantitative easing (QE2). It is widely believed that they will print several hundred billion dollars, which will be used to purchase treasury bonds from banks in order to inject additional cash into the banking system. The idea is that this will encourage banks to lend more money to businesses to create jobs.

However there is a fair bit of skepticism in the press about the magnitude of the impact this is likely to have. Part of the concern is that the banks are already sitting on very large cash reserves and yet are not lending much of it. Annie Lowrey commented on this in Slate yesterday (underline added) –

If QE2 is to work, it will have to work differently than QE did—and probably won’t work as well… So how might it work? One hope is that by giving banks cash in exchange for assets, the Federal Reserve will induce banks to lend. With more cash on hand, the banks will be more willing to make loans to homeowners and businesses. But the reason for the banks’ current stinginess has little to do with the size of their reserves—banks are sitting on excess capital, as are the big companies they like to lend to. Banks are not making loans because they don’t see anyone or thing worth lending money to. Just because they have $500 billion or even $100 trillion more to lend doesn’t mean they will decide to lend it.

So banks don’t see anyone worth lending money to. That strikes me as a little disturbing. The reason is that it makes me wonder what exactly it is that America’s business schools have been doing all these years (US News and World Report ranked 426 of them) to produce a population of business people who are apparently incapable of developing compelling business strategies that don’t depend on strong or growing consumer demand. In an economic climate like the one that currently prevails, I have to imagine that the best chance of stimulating real economic growth is through innovation that improves the productivity of business rather than directly increasing output. Yet bank funds are evidently not being funneled into investments that create this kind of innovation.

Of course there may be other explanations besides the inadequacy of America’s business schools (not that I’ve given up on that hypothesis, but it doesn’t hurt to speculate…). Perhaps the defect is not with business schools but with engineering schools producing graduates who don’t know how to innovate effectively – but of course that couldn’t possibly be true :). Maybe a more plausible explanation is that the kind of investment needed to create innovations that improve productivity is not typically provided in the form of bank loans, but through venture capital – which perhaps points to a more fundamental problem with QE2.

Posted in Economics, Education | Leave a comment

Ignorance or Hypocrisy?

Last week the US House of Representatives passed the Currency Reform for Fair Trade Act, a bill that would allow the Commerce Department to impose tariffs on imports from countries it believes manipulate their currencies. The point of the legislation is mainly to enable the US to punish China, which is widely believed to be keeping the value of the Yuan low artificially in order to enhance the competitiveness of Chinese exports. The result is that the US has a very large trade deficit with China – $227 billion in 2009, which many people think inhibits manufacturing and employment in the US.

ABC News quoted House Speaker Nancy Pelosi expressing precisely this concern –

“For so many years, we have watched the China-U.S. trade deficit grow and grow and grow,” Speaker Nancy Pelosi said. “Today, we are finally doing something about it by recognizing that China’s manipulation of the currency represents a subsidy for Chinese exports coming to the United States and elsewhere.”

The same article also reported remarks by Democratic Majority Leader Steny Hoyer –

“I believe in free markets and open competition. I believe that American companies and workers can win under those conditions. But the rules have to be fair—and for years now, it has been clear that China’s currency policy unfairly tilts the field in its direction,” Majority Leader Steny Hoyer said in statement. “By deliberately keeping the value of its Yuan low, China is able to sell products here at an artificially low price. As a result, domestic manufacturers—whose prices would be much more competitive if China allowed the market to set the value of its currency—go out of business. And American workers lose their jobs.”

Ah yes… free markets, open competition, the noble pursuit of justice for the American worker. It’s inspiring!

However it is a shame that Pelosi and Hoyer and the 346 other Democratic and Republican representatives who voted for the legislation and who express indignation over the damage they imagine Chinese subsidies do to the US economy apparently don’t feel the same concern about the $15.4 billion in subsidies that they themselves paid to American farmers last year ($245 billion since 1995), nor the impact that that has on foreign agricultural producers, many of whom live in developing countries in extraordinary poverty.

A case in point is Haiti, where, according to a report published this week by Oxfam, 90% of the rural population lived on $2/day before the earthquake in January and two-thirds on less than $1/day. They note that after Haiti lowered their own trade barriers in the mid-nineties under pressure from the international community, they went from being self-sufficient in rice production to having to import 80% of what they need because Haiti’s own farmers are no longer able to compete with cheap imported rice.

Haiti’s poverty is undoubtedly a complex problem and I don’t claim to have an in depth knowledge of the subject. But the fact is that rice farmers in Haiti, one of the poorest countries in the world, are forced to compete with American farmers whose production is subsidized by the US government, to the tune of $434 million in 2009. How Pelosi and Hoyer reconcile that with their disdain for Chinese subsidies is perplexing to say the least.

The Oxfam report points out that subsidies have helped the US gain a 16% share of the $11 billion global market for rice and that Haiti is the third largest export market for US rice production. They also make the interesting observation that US rice subsidies significantly exceed the $353 million of aid the US gave to Haiti in 2009 and is about 20 times greater than the aid given specifically to improve agriculture. It’s also interesting that US rice subsidies supported 611 US farmers in 2009, while Haiti has some 1 million farming families.

Incidentally, former President Bill Clinton has recently declared the US policy towards Haiti, and particularly his own role in putting it into effect, a serious mistake. A video report on his comments was presented this week by Pacifica Radio’s Democracy Now! show. Whatever else you think about Bill Clinton, I think he deserves credit for his willingness to accept responsibility for his own role in instituting a policy that has been very harmful to Haiti.

Posted in Trade Policy | Leave a comment

Brookings on Controlling the Deficit

The Brookings Institution released a paper today (ok it’s now after midnight – I guess it was yesterday) titled The Future is Now: A Balanced Plan to Stabilize Public Debt and Promote Economic Growth, by William Galston and Maya MacGuineas. The authors lay out both a set of principles and a fairly detailed plan for getting the budget deficit and government debt under control. Their plan aims to limit and stabilize government debt at the end of this decade at 60% of GDP, compared with current projections that have the debt at 90% in 2020 and increasing dramatically beyond that.

They argue first of all that controlling the deficit and debt is important in order to ensure the future health of the US economy, more important that many commentators acknowledge. They point to four specific problems that excessive debt can cause –

  1. it slows economic growth by competing with the private sector’s need for capital
  2. increasing interest payments compete with other spending priorities
  3. interest payments on debt held outside the US transfer wealth out of the country.
  4. excessive debt raises the risk of a future fiscal crisis

In order to address the threat of a spiralling deficit, they outline five principles that they believe should guide future budget reform –

  1. Promote shared sacrifice
  2. Encourage growth
  3. Protect this in need and increase progressivity
  4. Enhance the transparency of our spending priorities
  5. Acknowledge demographic and health care realities

Based on these principles, they lay out what seems to be a reasonably credible plan that involves cuts to defense, domestic discretionary, social security, health, tax expenditure (exemptions) and other spending and increases in revenue.

I’m not in a position to gauge the accuracy of the numbers they give, but what I think is striking is the fact that they (i) do actually attach numbers to the potential savings available in different areas of government spending, (ii) provide some degree of analysis to explain the assumptions that underlie those numbers and (iii) show how those savings in aggregate would lead to a budget deficit of less that 1% of GDP and debt stabilized at 60% of GDP by 2020.

This is in marked contrast to the hand-waving generalities contained in the Republicans’ “Pledge to America”, which promises to control spending, but makes no credible attempt to indicate exactly how potential savings might actually lead to a stable future fiscal position.

It’s encouraging to see a contribution to public debate like the one from Galston and MacGuineas. I was particularly interested to see this comment –

“We believe that the American people want their leaders to treat them like adults who are capable of accepting the truth. But this cannot happen until our leaders begin to act like adults who are interested in solving problems rather than scoring political points.”

On reading this, part of me wants to say “yes please!”, because there is surely a need for exactly this kind of leadership in the US. However I do have to take issue a little with the suggestion that “the American people want…”. I see politicians and commentators so often invoking their own particular claims about what “the American people” want or think and most of the time it is just self-serving nonsense.

The reality is that there is enormous diversity of attitude and opinion within the US and if we are to be realists (which is what Galston and MacGuineas are advocating after all), then I think we should acknowledge that this is true in this context as well. I would go further and suggest that many American people (and I certainly don’t mean that Americans are different in this respect from people elsewhere) actually aren’t “adults who are capable of accepting the truth”, and that that is precisely the reason that they have the politicians they do.

Posted in Economics | 4 Comments

St Lukes Expansion Reprieve

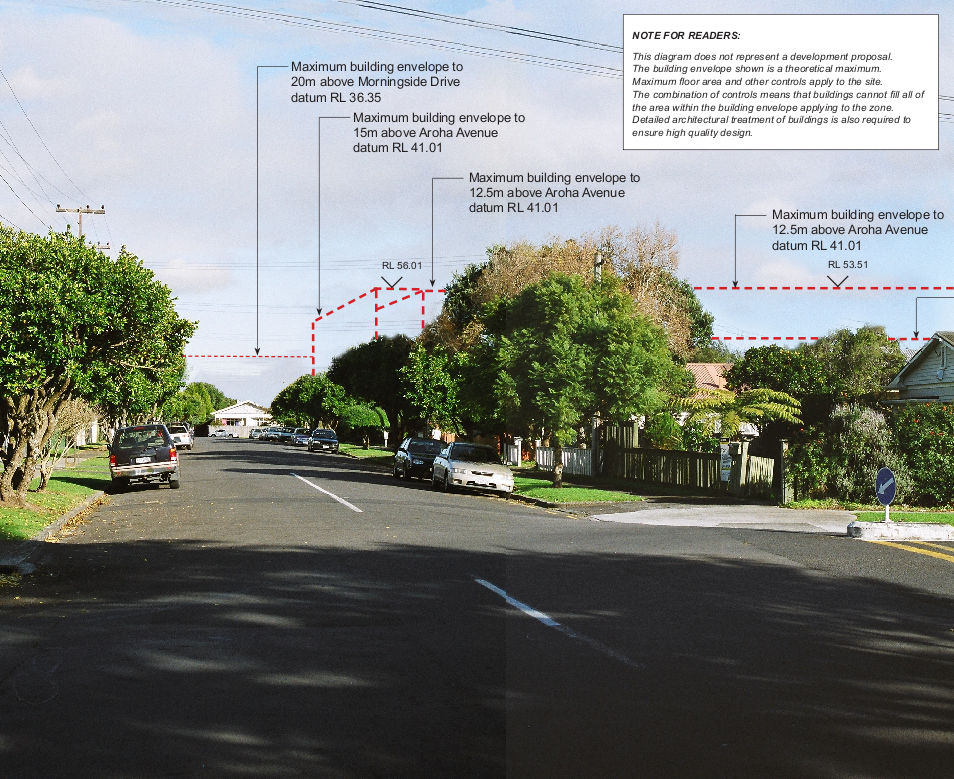
I was pleased to read a few days ago that the Auckland City Council has deferred a decision on whether to approve a proposed expansion of the St Lukes mall in Mt Albert. I grew up in Mt Albert so I know the place well and I’m not impressed at all with what is being proposed. It involves significantly expanding both the size of the site and the height of the buildings, resulting in a doubling of the overall size of the mall, which is located in the middle of a residential area. I think the proposal would have an undesirable visual impact on the area, especially for nearby residents, and I have concerns about the likely impact on traffic. Particularly disturbing to me is that a residential side street that is currently completely separate from the mall property would become an access street bordering multi-level mall buildings.

The proposal was initially filed with the Council in April last year, so I am pretty late to the issue, but it does not appear to have been covered very much in the Auckland press, so perhaps I have an excuse. The NZ Herald ran articles on two consecutive days in late April ’09 (here and here) and followed that the next day with a reader comment page. The overall public reaction was strongly negative.

As far as I can tell, the next report in the Herald was on June 26 this year, when they noted that independent commissioners had begun hearing submissions on the proposal. On Wednesday last week, they reported that the commissioners had recommended the proposal be approved, but on Friday reported that Council had declined to make a final decision.

There are two satellite images below showing the current site and the proposed expansion relative to the surrounding area. Following that are four images provided with the application that show the proposed new building limits superimposed on photos taken from different locations around the mall (this just represents an overall envelope – no specific building plan has been released). The square red labels on the second map show where those photos were taken from.

Having lived for six years in Sydney, where St Lukes’ Australian owners, Westfield, dominate the retail property market, I don’t find this proposal entirely surprising – it seems to represent a design ethos that’s very similar to what I’ve experienced there: place as much store space into a given site area as legally possible. With the current proposal, they are seeking to get the zoning rules changed to allow them not only to increase the size of the site but also apparently to increase floor space significantly relative to land area.

Just by way of comparison, a suburban mall like this in the Chicago area where I now live (and there are many) would differ in at least three respects –

  • The site would be located within a much broader commercial area, surrounded for example by other retail and office buildings.
  • Access to the site would be from major roadways only.
  • The majority of the parking would be at ground level surrounding the mall, creating a visual buffer between the road and the mall buildings.

Obviously different communities in different countries have different sets of assumptions and expectations about what constitutes reasonable parameters for urban design. Apart from the impact on the local residents, it’s possible that many in New Zealand may not object to the general appearance of the proposal. However, all I can say is that having lived both there (Mt Albert) and here (Chicago), my own subjective feeling is that the urban planning philosophy here results in a much more livable environment than I see there.

The Auckland City Council will eventually make their own decision, no doubt. One of the realities of the modern world that I am personally grateful for is the mobility of labour. As an expat kiwi who has made a personal choice to live outside New Zealand, I do hope one day to move back to New Zealand – it is truly a great place and it will never stop being home. But when I see the kind of approach to urban design evident here, if Auckland’s leaders were to ever think it might be desirable to attract people like me to move back to NZ from overseas, and if they thought that this kind of thing would encourage me to live and work in Auckland, all I can say, with respect, in the words of Darryl Kerrigan, is “tell ’em they’re dreamin.”

I may yet have more to say about this, but this will do for now.

Location #1:

Location #2:

Location #3:

Location #4:

Posted in Urban Design | Leave a comment

The Republicans’ ‘Pledge to America’

A preview of the Republican’s new Pledge to America has been released to news organizations today and will reportedly be launched formally tomorrow. I’ve taken a fairly quick look through it, mostly the parts that relate to the economy, and have a few initial observations. The document has seven sections (not numbered in the document itself) –

  1. A Plan to Create Jobs, End Economic Uncertainty, and Make America More Competitive.
  2. A Plan to Stop Out-of-Control Spending and Reduce the Size of Government
  3. A Plan to Repeal and Replace the Government Takeover of Health Care
  4. A Plan to Reform Congress and Restore Trust
  5. A Plan to Keep Our Nation Secure at Home & Abroad
  6. Checks and Balances
  7. Call to Action

My initial reactions –

  • Under a heading “Our Plan to Put Government on a Path to a Balanced Budget”, they talk about a number of measures that may be worthwhile. However my impression (and I need to do more research on this) is that the largest challenge to a balanced budget is actually entitlement spending. Yet on this subject, their final bullet point reads – “We will make the decisions that are necessary to protect our entitlement programs for today’s seniors and future generations” (emphasis added). There doesn’t appear to be any commitment to the kind of reforms that Paul Ryan has proposed.
  • There is no commitment to eliminating earmarks (as noted by CNN), even though under the heading “Checks and Balances” they say they “will fight to ensure transparency and accountability in Congress and throughout government.”
  • Despite claiming to want to “make America more competitive”, there is no commitment to eliminating trade barriers that limit the need for American producers to compete internationally. There is a pie chart showing the number of Federal assistance programs for each Government department, but they make no explicit commitments to reductions in any particular area and give no indication of how much reductions here might amount to.
  • There is no commitment to thorough-going tax reform.
  • There is no indication of an interest in any kind of banking or monetary reform.

Hopefully the media will shine some light on some of these issues once the plan is formally launched tomorrow (yeah right). So far I see more reasons to be cynical than excited.

[Update: in an earlier version of this post I also questioned some numbers in the Pledge document related to debt. However my numbers were based on ‘debt held by the public’ and excluded ‘intra-governmental debt’ like obligations to the Social Security Trust Fund. If you include both forms of debt (and I think it is reasonable to do so) the Pledge is correct in stating that the total is about $13 trillion and is on target to reach 100% of GDP within a couple of years. Here‘s the Treasury’s current data and here‘s a good Wikipedia article that discusses the issue in some detail.]

Posted in Economics, Republicans | Leave a comment