Last week the NZ Statistics Department released the “NZ Business Demography Statistics: At February 2010.” The data was reported by Newstalk ZB, who also had their story published by the NZ Herald.
The business demography statistics are primarily concerned with the rate at which businesses are being started and closed. The summary statement provided with the release notes that there were 43,700 ‘enterprise births’ over the year to February, down 20.4 percent from the previous year, while there 55,040 ‘enterprise deaths’ over the same time, up 6.0 percent from the previous year. They also note that at February 2010 there were 470,350 enterprises, down 1.7 percent compared with February 2009.
However, when I looked closely, the numbers didn’t seem to quite add up. If you calculate the nett company start-ups/closures for the year, it looks like they amount to more than the 1.7% fall in total businesses that was reported. I contacted Newstalk ZB to to ask for clarification (before I had seen the Statistics Department website) and got an automated response saying they would get back to me within 24 hours. And that was the last I heard from them – thanks a lot!
However I did have more success with the Statistics Department – someone’s taxes at work :). They explained to me that the business birth and death statistics are not quite what they seem. Rather than representing businesses started and closed in one year, the numbers are actually each counted over two consecutive years, which is why they aren’t consistent with the year-on-year percentage change in the overall number of businesses.
Ok, I don’t expect anyone other than me to find that interesting! But is there anything else here worth knowing about? In the original report, what stood out to me was the fact that start-ups were down 20% and business closures up by 6%. On the face of it, that sounds a bit dire and I guess it is, although as a fraction of total businesses the corresponding drop of 1.7% seems a little less calamitous.
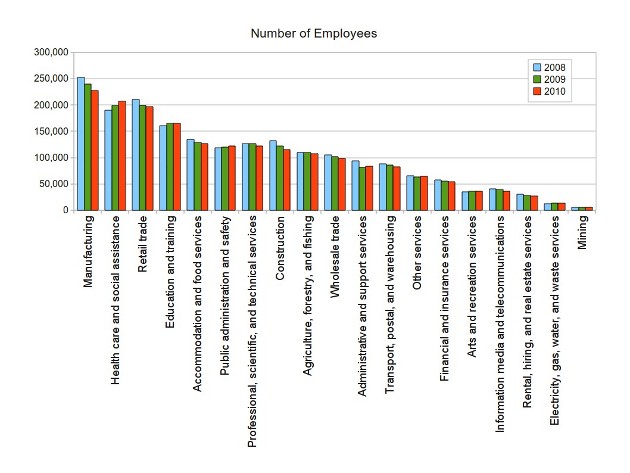
However I did find a couple of other things that I think are interesting – though again I’m probably the only person who thinks so :). Table 1 in this spreadsheet provides a breakdown of both businesses and employees by industry sector, using the ‘ANZSIC 2006‘ classification scheme. The business numbers aren’t particularly interesting, but the employment data a little more so. I went back and found the corresponding data for both 2008 and 2009, and compared total employment in each major classification category between all three years. This is what I found –
Note that I have ordered the classifications by the number of employees in each one in 2010. A couple of things I think are worth highlighting –
- I was surprised (pleasantly) to see that manufacturing employs the largest number of people in NZ (I’m not sure what I would have guessed if you’d asked me before I’d seen the data, but I don’t think of NZ as a strong manufacturing country). I was also surprised by the fact that healthcare and social assistance employs the second largest number.
- Based on these statistics there has been an overall drop in employment of 4% over the past three years. The three biggest decreases have been in manufacturing, retail and construction, collectively accounting for 2.8%. Over the same period, the three largest increases in employment have been in healthcare and social assistance, education and training and public administration and safety, which together amount to an increase of 1.2% of total employment. So as well as an overall drop in employment, there seems to be a small shift away from the part of the economy that creates and sells things into the part that essentially provides the social infrastructure that supports those activities.

