
WARNING: The following contains quite a lot of fairly arcane discussion about economic data. Proceed at your own risk.
The Australian Financial Review isn’t a paper I normally read online, and I can’t remember now what inspired me to go looking for it today. However I was interested to see this article in the Fin reporting on the Australian trade deficit, particularly given the recent news on the NZ trade situation.
The article is actually not very informative, only providing the size of the deficit for January (2.69 Billion) and comparing it with the expected value (1.3 Billion) and the December number (1.15 Billion). I was more interested in how it compared with exports and with GDP, particularly on an annual basis, since this gives a better sense of what the numbers really mean.
As it turned out I had to dig pretty hard to find everything I was looking for. I found four articles in the Sydney Morning Herald. This one from March 3 just gives the same data as the AFR, although it also quotes the National Australia Bank chief economist Rob Henderson expressing concern about the potential implications for the first quater GDP and current account.
This article, also in the SMH on March 3, titled “Economic figures make for gloomy reading“, reports the raw deficit number and mentions the significance of the number relative to GDP, but doesn’t say what that proportion is. It does provide the January exports figure of 15.2 B, which shows that the deficit was 17.7% of exports for that month. Mind you, it claims that “exports hit $15.2 billion in January, to be $1.7 billion (18 per cent) higher than a year earlier“, failing to mention what the AFR referred to as “a 7 per cent plunge in exports” from the previous month.
The same day, this article quotes federal trade minister Mark Vaile claiming that the result was just “a glitch”.
“We need to look at this over the longer trend,” he told reporters. “The longer trends, particularly as far as commodities are concerned, has been a significant increase.”
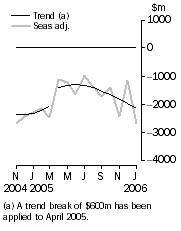
Is the trend Mr Vaile had in mind? Or was he perhaps thinking of this trade deficit trend plot from the Australian Bureau of Statistics -
 Maybe that’s not a long enough time frame for Mr Vaile. Interestingly on the commodities issue, the AFR notes that the 7% drop in exports in January was “driven by metals“.
Anyhow, nothing in the Herald really gave me a lot of insight into the Australian trade situation or helped me to compare it with NZ. To get that I had to go digging through the ABS website. What I discovered is the following -
As noted, the January trade deficit is 17.7% of exports (January exports 15,178 M, January imports 17,868 M). To understand how this relates to the annual situation, I trawled through all the individual monthly numbers (here) and discovered that the trade deficit to December was 20,628 M, which is 11.7% of exports (2005 exports were 175,666 M, imports were 196,294 M).
Getting at the relationship of the trade result to GDP was also a bit of a challenge. The quarterly GDP data for 2005 can be found on p16 of this document. The total for 2005 is 870.24 B. This means that the trade deficit for the year to December was 2.4% of GDP, and the January deficit by itself, is just 0.31% of GDP.
Comparing the monthly trade deficit with annual GDP is clearly not extremely informative, but I mention it only to make a comparison with the NZ situation (which is what I am really interested in). There the deficit for the year to December was 3.9 B, which is 12.6% of 2005 exports and 2.6% of GDP (v. slightly above the Australian numbers of 11.7% and 2.4%, but better than the US trade deficit of 5.8% of GDP).
The NZ January deficit by itself was 935 M, which is 42.6% of January exports and 0.62% of 2005 GDP (much worse than the Australian numbers of 17.7% and 0.31%. Note also that the appalling NZ January trade result pushed the annual deficit to 4.7% of GDP, which is still below the US).
Incidentally, there is an implication in the above that both countries’ exports are roughly the same proportion of GDP. In Australia 2005 exports of 175 B represents 20.2% of GDP, while in NZ 2005 exports of 31 B represents 20.4% of GDP. Sometime I must look into the relative composition of exports in terms of commodities, primary produce and manufactured goods.
There is one more comparison that I wanted to check, which is the current account deficit. I noted a few days ago that the NZ deficit is an incredible 8.5%. The raw Australian quarterly current account balance can be found here. The total 2005 is a deficit of 55,406 B, which amounts to 6.4% or GDP, slightly better than the supposedly dire US figure of 6.7%.